CAPITAL SIGNS × ATL AIRPORT OPERATIONS

CAPITAL SIGNS × ATL AIRPORT OPERATIONS

ATL WAIT TIME

TOTEMS

ATL

WAIT TIME

TOTEMS

ATL

WAIT TIME

TOTEMS

Making airport wait times legible, location-aware, and operationally resilient.

Making airport wait times legible, location-aware, and operationally resilient.

Making airport wait times legible,

location-aware, and operationally resilient.

ROLE

Digital Experience Project Manager

Digital Experience Project Manager

TIMELINE

Oct 2025–present · launched Nov 2025

Oct 2025–present · launched Nov 2025

SYSTEM

15 mapped display locations

15 mapped display locations

01 / OVERVIEW

01 / OVERVIEW

A visual redesign became

an operational system.

A visual redesign became

an operational system.

I transformed an inherited wait-time concept into a location-aware passenger information system, then managed development, testing, and delivery across fifteen mapped airport display locations.

I transformed an inherited wait-time concept into a location-aware passenger information system, then managed development, testing, and delivery across fifteen mapped airport display locations.

MY SCOPE

MY SCOPE

Information hierarchy

Multi-format layouts

Figma variables + annotations

Developer handoff

Live-data and display testing

Delivery + ongoing fixes

15

15

mapped display locations

mapped display locations

4

4

final output formats

final output formats

5 MIN

5 MIN

data refresh interval

data refresh interval

ONGOING

ONGOING

operations and maintenance

operations and maintenance

02 / THE REDESIGN

02 / THE REDESIGN

The system worked.

Its meaning did not.

The system worked.

Its meaning did not.

The system worked.

Its meaning did not.

ATL already had Xovis phased wait-time data and a distributed display network. The challenge was comprehension: stakeholders did not clearly understand why two nearby displays could show different estimates, while passengers lacked enough context to interpret them.

ATL already had Xovis phased wait-time data and a distributed display network. The challenge was comprehension: stakeholders did not clearly understand why two nearby displays could show different estimates, while passengers lacked enough context to interpret them.

ATL already had Xovis phased wait-time data and a distributed display network. The challenge was comprehension: stakeholders did not clearly understand why two nearby displays could show different estimates, while passengers lacked enough context to interpret them.

03 / INFORMATION MODEL

03 / INFORMATION MODEL

Making phased logic

understandable.

Making phased logic

understandable.

Making phased logic

understandable.

Xovis calculates each estimate through ATL-defined, color-coded phase zones. I learned the inherited system and translated it into clearer display states, stakeholder explanations, and developer handoffs.

Xovis calculates each estimate through ATL-defined, color-coded phase zones. I learned the inherited system and translated it into clearer display states, stakeholder explanations, and developer handoffs.

Xovis calculates each estimate through ATL-defined, color-coded phase zones. I learned the inherited system and translated it into clearer display states, stakeholder explanations, and developer handoffs.

FROM THIS POINT / MAPPED DISPLAY

FROM THIS POINT / MAPPED DISPLAY

At a mapped display, the estimate begins from that physical location. Before the queue, it adds walking time to the live queue endpoint; inside the queue, it reports only the remaining phases.

At a mapped display, the estimate begins from that physical location. Before the queue, it adds walking time to the live queue endpoint; inside the queue, it reports only the remaining phases.

At a mapped display, the estimate begins from that physical location. Before the queue, it adds walking time to the live queue endpoint; inside the queue, it reports only the remaining phases.

DISPLAY

QUEUE END

SECURITY

LOCATION → QUEUE END → REMAINING PHASES

LOCATION → QUEUE END → REMAINING PHASES

LOCATION → QUEUE END → REMAINING PHASES

DISPLAY

DISPLAY

QUEUE END

QUEUE END

SECURITY

SECURITY

DISPLAY

QUEUE END

SECURITY

FROM END OF QUEUE / DECISION POINT

FROM END OF QUEUE

/ DECISION POINT

FROM END OF QUEUE / DECISION POINT

At a checkpoint decision point, the estimate begins at the current end of the queue and reports the phased wait to screening without adding travel from a remote display.

At a checkpoint decision point, the estimate begins at the current end of the queue and reports the phased wait to screening without adding travel from a remote display.

At a checkpoint decision point, the estimate begins at the current end of the queue and reports the phased wait to screening without adding travel from a remote display.

DISPLAY

DISPLAY

QUEUE END

QUEUE END

SECURITY

SECURITY

QUEUE END + REMAINING PHASES

QUEUE END + REMAINING PHASES

DISPLAY

QUEUE END

SECURITY

04 / DISPLAY NETWORK

04 / DISPLAY NETWORK

Fifteen displays, mapped to

the phases around them.

Fifteen displays, mapped to

the phases around them.

Fifteen displays, mapped to the phases around them.

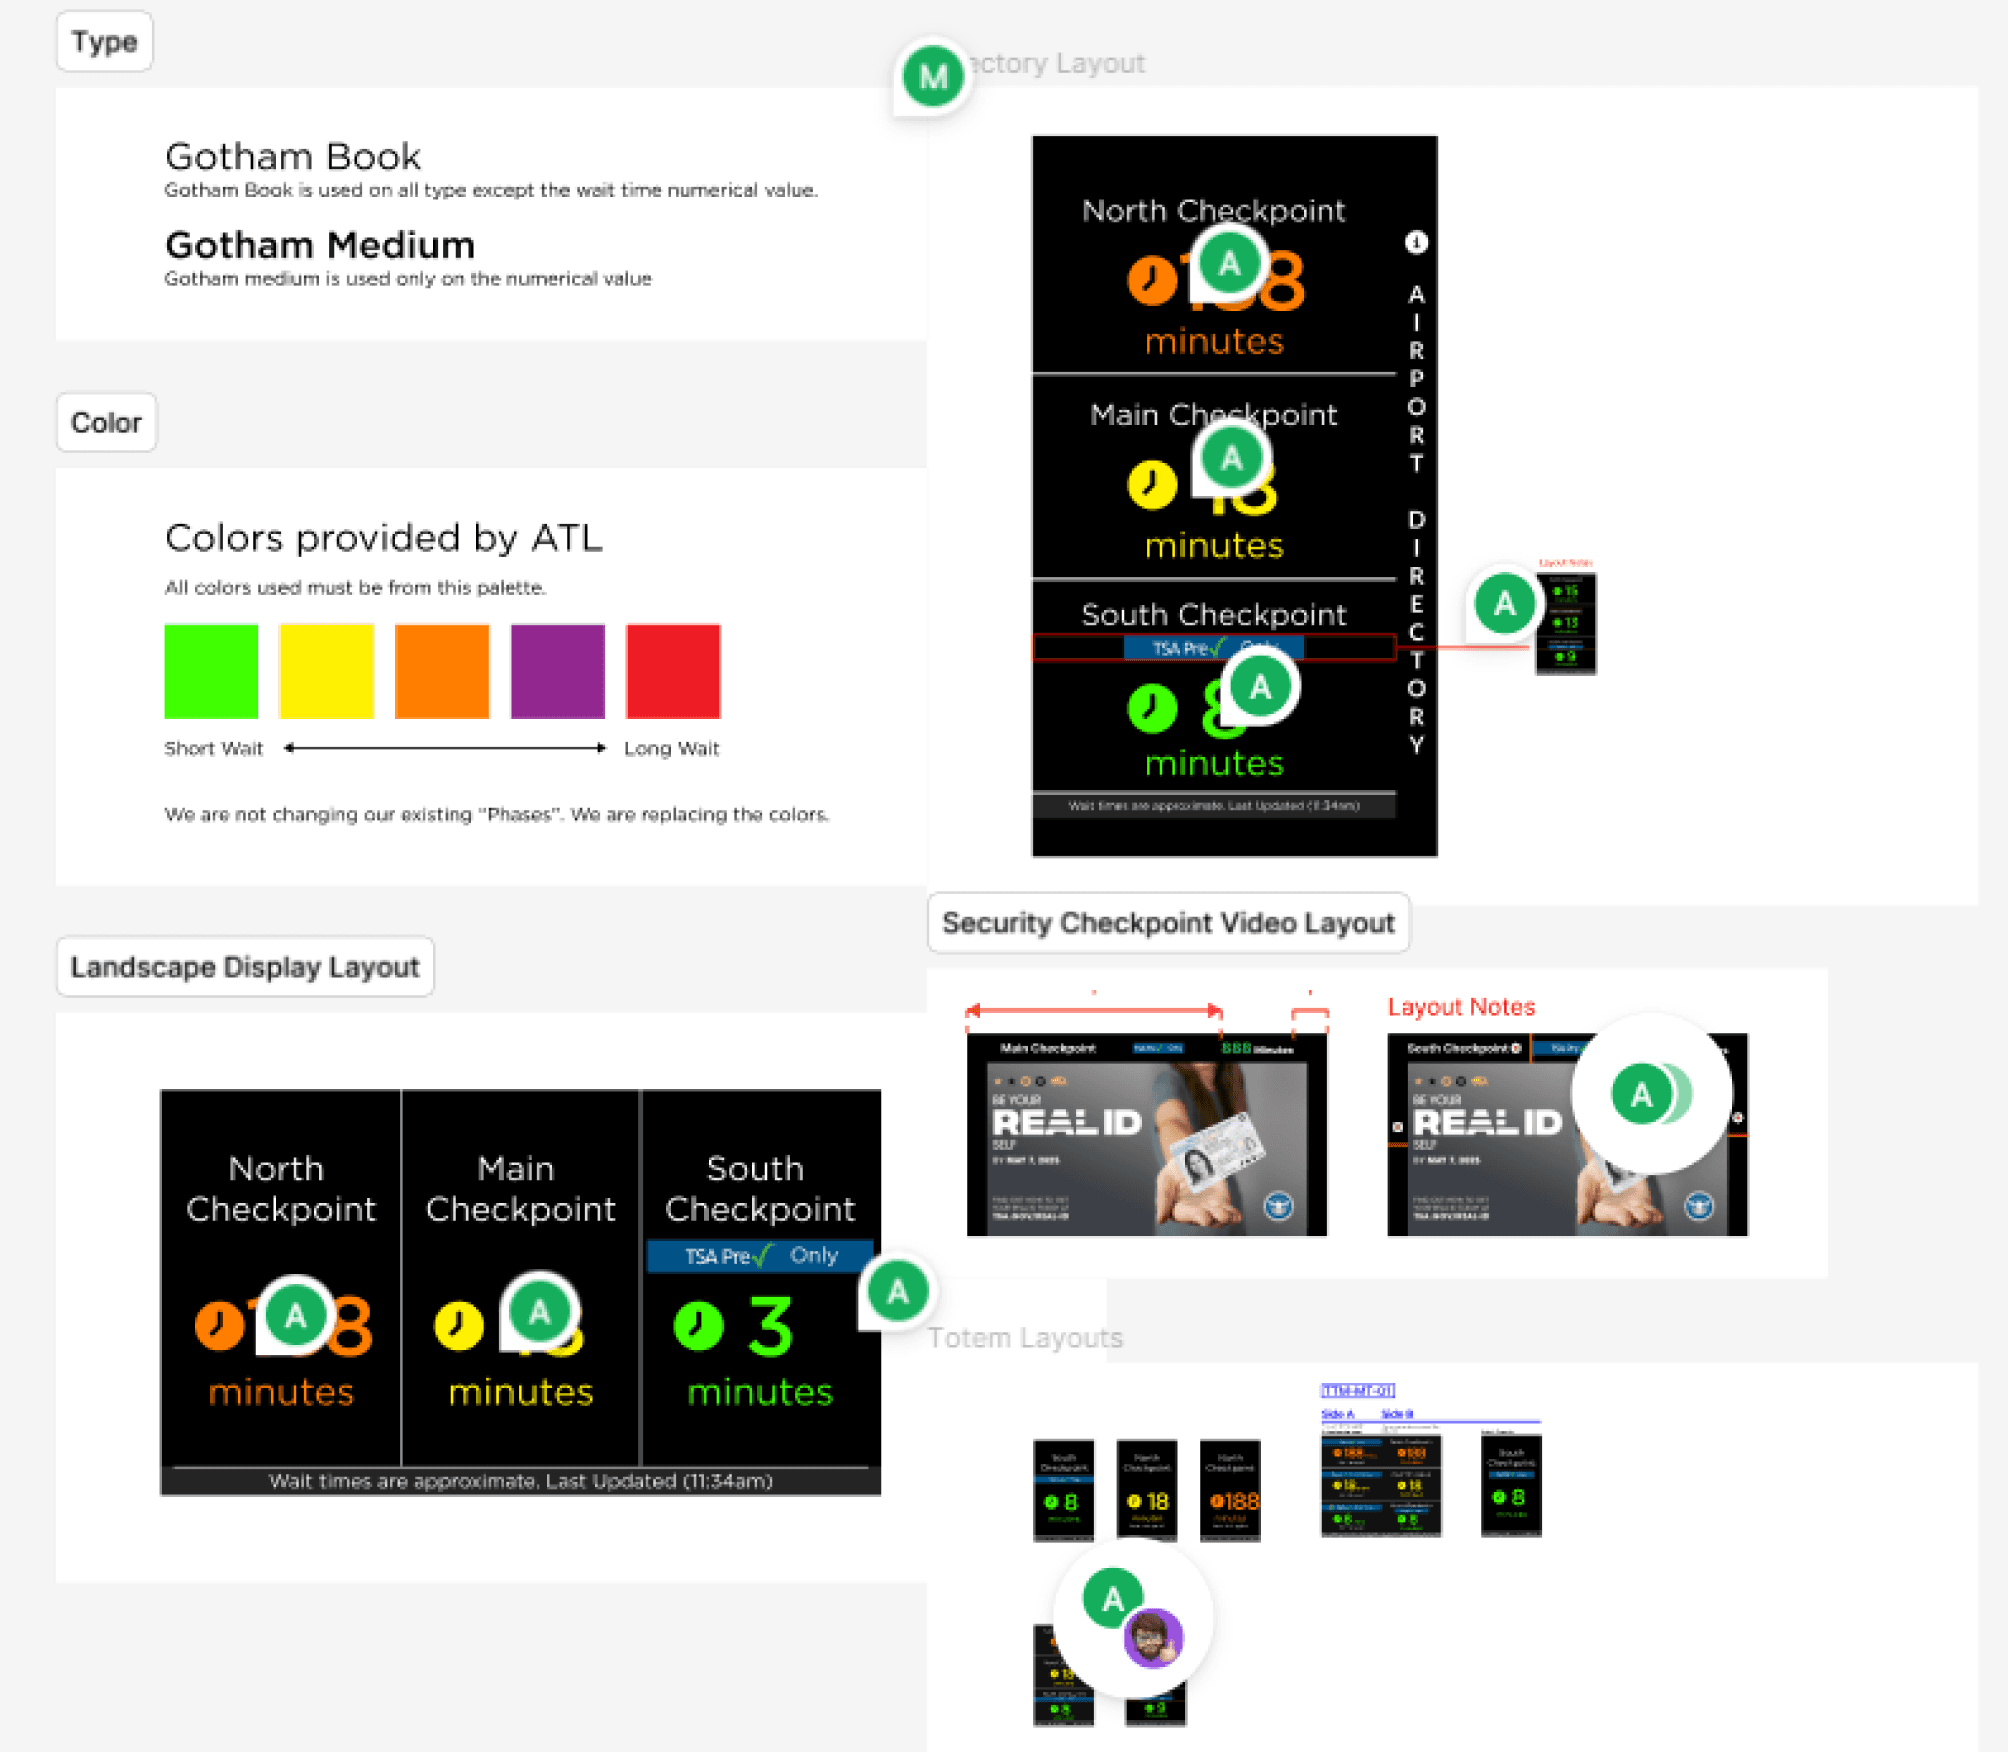
The totems are strategically placed along cue lines for security checkpoints North, Main and South. It uses Xovis phased time calculations to communicate expectations and inform passengers at decision-making points, reducing traffic and confusion.

The totems are strategically placed along cue lines for security checkpoints North, Main and South. It uses Xovis phased time calculations to communicate expectations and inform passengers at decision-making points, reducing traffic and confusion.

The totems are strategically placed along cue lines for security checkpoints North, Main and South. It uses Xovis phased time calculations to communicate expectations and inform passengers at decision-making points, reducing traffic and confusion.

Each display’s fixed Wayfinder location requests the appropriate phase-based estimate. The number changes with passenger position because the calculation begins at a different point in the journey.

Each display’s fixed Wayfinder location requests the appropriate phase-based estimate. The number changes with passenger position because the calculation begins at a different point in the journey.

05 / SYSTEMS THINKING

05 / SYSTEMS THINKING

Multiple data owners.

One passenger-facing answer.

Multiple data owners.


One passenger facing answer.

Multiple data owners.

One passenger-facing answer.

The display is the final layer of a larger service: sensing, airport operations, location mapping, orchestration, and clear communication at a glance.

The display is the final layer of a larger service: sensing, airport operations, location mapping, orchestration, and clear communication at a glance.

The display is the final layer of a larger service: sensing, airport operations, location mapping, orchestration, and clear communication at a glance.

XOVIS

Queue length

Calculated wait time

Location-adjusted travel time

Queue length

Calculated wait time

Location-adjusted travel time

ATL OPERATIONS

Passenger counts

Checkpoint status

Tier availability + phase values

Passenger counts

Checkpoint status

Tier availability + phase values

ACQUIRE WAYFINDER

Fixed display identifiers

Mapped routes + orchestration

Timestamp and five-minute refresh

Fixed display identifiers

Mapped routes + orchestration

Timestamp and five-minute refresh

OPERATIONAL CONTENT MODEL

OPERATIONAL CONTENT MODEL

ADAPTED FOR MANY FORMATS

ADAPTED FOR MANY FORMATS

The wait time data is displayed throughout the atrium. In addition to the totems and landscape screens, it is also displayed above the security checkpoint videos and directories—each drawing from the same operational logic while adapting to its location and viewing distance.

The wait time data is displayed throughout the atrium. In addition to the totems and landscape screens, it is also displayed above the security checkpoint videos and directories—each drawing from the same operational logic while adapting to its location and viewing distance.

The wait time data is displayed throughout the atrium. In addition to the totems and landscape screens, it is also displayed above the security checkpoint videos and directories—each drawing from the same operational logic while adapting to its location and viewing distance.

STANDARD TOTEM

320 × 540

LANDSCAPE DISPLAY

3840 × 2160

AIRPORT DIRECTORY

2160 × 3840

VIDEO + WAIT TIME

1920 × 1080

06 / STATE DESIGN

06 / STATE DESIGN

Design for normal operation—

and the moments that are not.

Design for normal operation—

and the moments that are not.

Design for normal operation—

and the moments that are not.

The system needed clear treatments for active phases, closed checkpoints, and unavailable data. I designed the final Closed and unavailable states while documenting the airport’s existing override logic.

The system needed clear treatments for active phases, closed checkpoints, and unavailable data. I designed the final Closed and unavailable states while documenting the airport’s existing override logic.

The system needed clear treatments for active phases, closed checkpoints, and unavailable data. I designed the final Closed and unavailable states while documenting the airport’s existing override logic.

ACTIVE PHASES

Operational colors carry urgency while the hierarchy stays fixed.

CLOSED CHECKPOINT

A direct state replaces time when a checkpoint is unavailable.
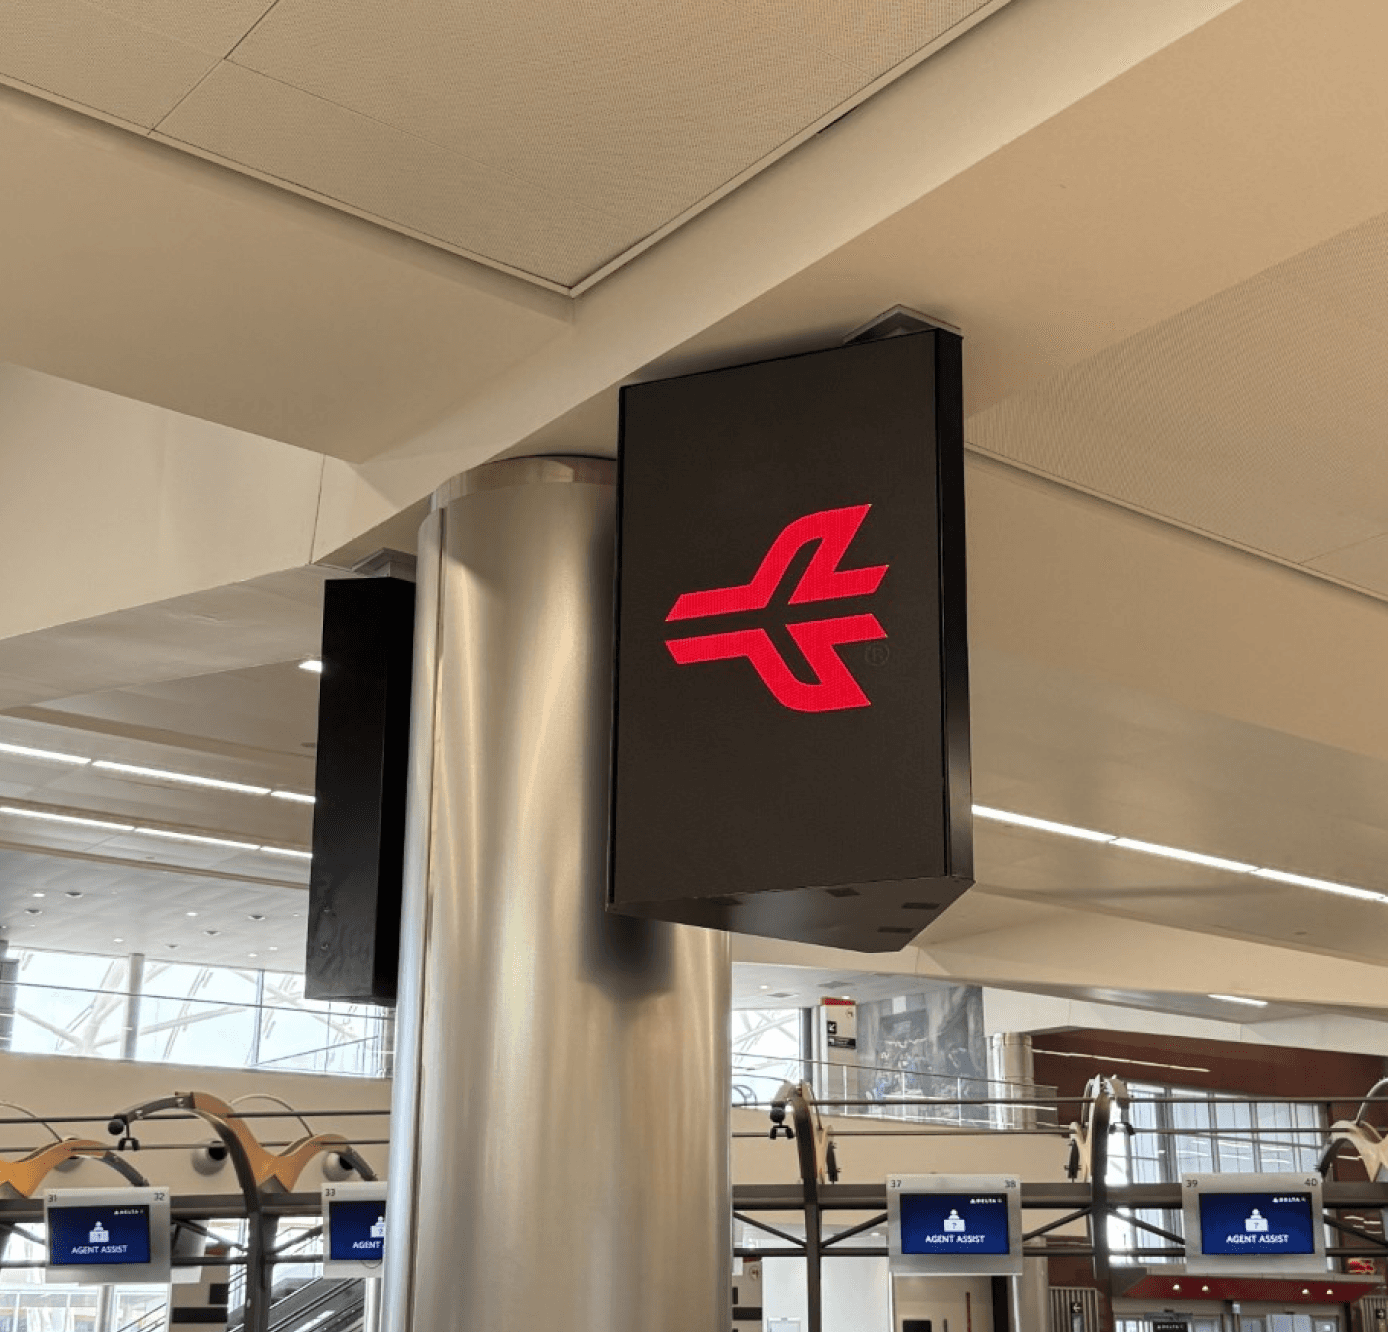
INTERRUPPED DATA FEED

If the Xovis data stops updating, the ATL Logo appears as a fallback image, as to not inaccurately inform passengers.

07 / VALIDATION

07 / VALIDATION

Test the data, the display,

and the distance.

Test the data, the display,

and the distance.

Test the data, the display,

and the distance.

Validation focused on operational behavior and technical delivery: simulated and live feeds, installed screens, and legibility in the terminal. No traveler study was conducted within the project timeline.

Validation focused on operational behavior and technical delivery: simulated and live feeds, installed screens, and legibility in the terminal. No traveler study was conducted within the project timeline.

Validation focused on operational behavior and technical delivery: simulated and live feeds, installed screens, and legibility in the terminal. No traveler study was conducted within the project timeline.

01

SITE OBSERVATION

Review the physical context, sightlines, surrounding wayfinding, and passenger approach.

02

SIMULATED + LIVE DATA

Exercise checkpoint combinations and compare system output with expected Xovis and airport states.

03

PHYSICAL DISPLAYS

Compare the developed build against the handoff on the installed hardware.

04

VIEWING DISTANCE

Assess scan speed, type weight, and hierarchy from realistic terminal distances.

FEED CONFUSION

FOUND

South checkpoint TSA lines were mapped incorrectly.

CHANGED

Worked with airport technical teams and Xovis to identify and correct the data issue.

IMPLEMENTATION DRIFT

FOUND

Spacing shifted between the annotated handoff and the developed display.

CHANGED

Adjusted production spacing after testing on the physical screens.

LEGIBILITY AT DISTANCE

FOUND

Some type lacked enough scale and weight in the terminal context.

CHANGED

Increased font size and boldness to improve readability from farther away.

08 / HANDOFF + DELIVERY

08 / HANDOFF + DELIVERY

The design had to survive

a live operational stack.

The design had to survive

a live operational stack.

The design had to survive

a live operational stack.

I translated the approved phased logic into developer-ready files, tested the implementation with Acquire Digital and Xovis, and continue to manage fixes as airport routes, mappings, and feeds change.

I translated the approved phased logic into developer-ready files, tested the implementation with Acquire Digital and Xovis, and continue to manage fixes as airport routes, mappings, and feeds change.

I translated the approved phased logic into developer-ready files, tested the implementation with Acquire Digital and Xovis, and continue to manage fixes as airport routes, mappings, and feeds change.

DEVELOPER HANDOFF

ONGOING OPERATIONS

A change upstream can alter

what passengers see.

A change upstream can alter

what passengers see.

When Wayfinder routes or field mappings change, the links between a display and its wait/travel calculation can break. The result can be a missing or inaccurate time—even when the screen layout itself is unchanged.

When Wayfinder routes or field mappings change, the links between a display and its wait/travel calculation can break. The result can be a missing or inaccurate time—even when the screen layout itself is unchanged.

01

MONITOR

Spot missing or inconsistent output.

02

TRACE

Check routes, fields, and display mapping.

03

COORDINATE

Work across ATL, Acquire, and Xovis.

04

VERIFY

Retest the live display after the fix.

09 / OUTCOME

09 / OUTCOME

Launched in November 2025.

Still operating, adapting, and improving.

Launched in November 2025.

Still operating, adapting, and improving.

Launched in November 2025.

Still operating, adapting, and improving.

REAL-WORLD STRESS TEST

REAL-WORLD STRESS TEST

During a 2026 period of reduced TSA staffing, the system displayed unusually long waits and checkpoint closures—giving passengers a live operational picture when the terminal was under exceptional pressure.

During a 2026 period of reduced TSA staffing, the system displayed unusually long waits and checkpoint closures—giving passengers a live operational picture when the terminal was under exceptional pressure.

During a 2026 period of reduced TSA staffing, the system displayed unusually long waits and checkpoint closures—giving passengers a live operational picture when the terminal was under exceptional pressure.

01

01

CLEARER DECISIONS

CLEARER

DECISIONS

A consistent scan path makes checkpoint, status, and time easier to understand at a glance.

02

02

OPERATIONAL RANGE

OPERATIONAL

RANGE

The final hierarchy supports active phases, closures, unavailable data, and expanded South checkpoint service categories without changing its core scan path.

03

03

MAINTAINABLE DELIVERY

MAINTAINABLE

DELIVERY

Annotated handoff files, fixed identifiers, and ongoing cross-vendor testing support a live system that continues to evolve. Lower North coverage is planned for a future phase.

10 / REFLECTION

10 / REFLECTION

Operational UX lives

beyond the screen.

Operational UX lives

beyond the screen.

Operational UX lives

beyond the screen.

This project strengthened my ability to connect visual hierarchy with sensing, mapping, software behavior, physical context, and the realities of an evolving airport operation.

This project strengthened my ability to connect visual hierarchy with sensing, mapping, software behavior, physical context, and the realities of an evolving airport operation.

This project strengthened my ability to connect visual hierarchy with sensing, mapping, software behavior, physical context, and the realities of an evolving airport operation.

01

01

DESIGN THE MEANING

A wait time is only useful when passengers understand where it begins and what it includes.

02

02

TEST THE REAL OUTPUT

Distance, hardware, and implementation can change a design that looked resolved in Figma.

Distance, hardware, and implementation can change a design that looked resolved in Figma.

03

03

OWN THE DEPENDENCIES

Routes, identifiers, field mappings, and fallback states are part of the passenger experience.

PROJECT CREDITS

PROJECT CREDITS

Design, handoff, testing + delivery:

Andrew Yi - Capital Signs


Client + operational requirements:

Hartsfield-Jackson Atlanta International Airport Operations


Software + Wayfinder orchestration:

Acquire Digital


Passenger flow + queue analytics:

Xovis


Location-aware time logic:

Acquire Digital + Xovis

ATL WAIT TIME TOTEMS · OCT 2025–PRESENT

ATL WAIT TIME TOTEMS · OCT 2025–PRESENT